How to Set Up Google Analytics

In This Article
What are Google Analytics?
Google Analytics is a free tool designed to help you understand your customers’ behavior through statistics and web analysis. Google’s widely used digital analytics service tracks and reports website traffic. For example, if your company has an online store, Google Analytics can be used to track and analyze data from advertising campaigns to understanding your customer’s journey from ad click to purchase. The ability to track performance and progress with analytics is extremely valuable to marketers.
How to Start Using Google Analytics
To begin using Google Analytics, you’ll first need to create an account. Once you’ve created your account, you’ll add a JavaScript code provided by the platform to your website, which will allow data from your site to be collected. The data collected will reflect how users interacted with your page, how long they spent on your website, what pages they visited, and if they made a purchase. After the data is collected, Google Analytics creates different organized reports you can access.
Tips for Google Analytics beginners:
- Reference Google’s video guides to avoid confusion
- Define your main goals and objectives
- Learn the metrics and define which ones are important to you
- Pay attention to bounce rate and session duration
Accessing Your Google Analytics Dashboard
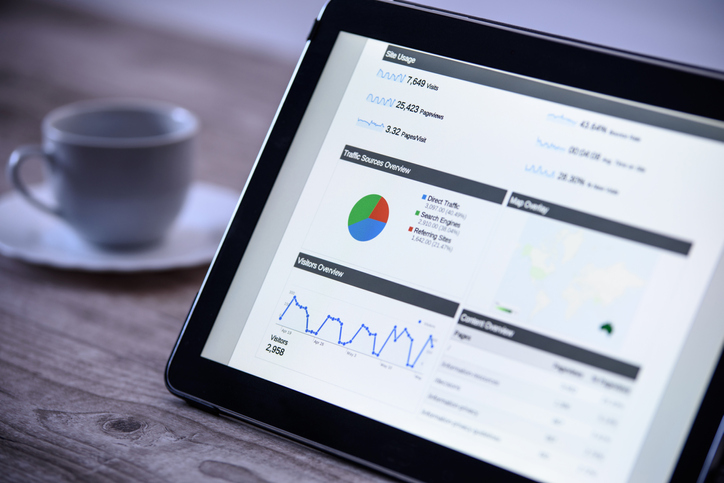
You can access your Google Analytics dashboard anytime to view statistics about your website, visitors, and site traffic.
How To Install a Google Analytics Code on Your Website
On your Google Analytics dashboard screen, you will see a text box with your tracking code. This tracking code is how Google tracks data associated with each page of your website. To set up your tracking code follow these steps:
- Copy the entire code within the Global Site Tag text box (appears on dashboard)
- Paste the tracking code at the beginning of the <head> tag of every webpage
- Publish website changes
If lost, tracking codes can be accessed from the dashboard. To find your code, go to Admin > Tracking Info > Tracking Code.
Managing and Configuring Analytics
Google analytics can track useful data from several different platforms. Google Analytics can track data from mobile apps, video game consoles, online-sales systems, and other internet-connected platforms. Configuration settings allow you to decide how your data is configured.
Analytics Reports
Google Analytics has the ability to track website activity and measure session duration as well as bounce rate and source of traffic. Google Analytics reports include:
- Audience reports
- Acquisition reports
- Behavior reports
Audience Reports
Audience reports are featured to better understand the characteristics of your site’s visitors including what country they are in, the language they speak, their demographics, and which device they used when visiting your website. Audience reports can be categorized into active user reports which can be broken down into 1, 7, 14, and 30-day sessions, also known as site reach. If you know who you want to target, these reports can let you know if you are reaching the right audience for your business or if there is an opportunity to reach a different audience. Additionally, audience reports can guide decisions about your content and marketing strategy.
Acquisition Reports
Acquisition reports can be used to compare performance of different channels as well as discover which sources are bringing you the highest quality traffic and conversion rates. The tracking code, as previously discussed, is used to track traffic coming and going from your site. This code will track where your organic traffic is coming from and what campaign brought them to your website.
Behavior Reports
Behavior reports data about page views in Google Analytics. This feature is used to calculate metrics such as page view frequency, average time on page, and bounce rate. This report will allow you to make future decisions on site content to increase page views or the time your customers spend on your website.
Additional reports generated in Google Analytics include mobile overview report, channel report, landing pages report, site speed overview, and goal overviews.
Campaign and Conversion
Campaign and Conversion tools within Google Analytics allow you to track your goals and create ecommerce reports.
Once you have created goals within Google Analytics, you will be able to view data collected based on goal paths, funnel visualization, and goal flow. Utilize the filters available to tailor your goals that align with your overall strategy.
Ecommerce reports can be sorted in Google Analytics depending on your preferred view. Reports can be created and collected based on product, sales, transaction, and number of times to purchase.
Once the ecommerce snippet is added to your site(s), the multi-channel funnel tool allows you to track how different channel feed into your funnels. Conversions, conversion paths, and path length can be measured through this.
How Will Google Analytics Help My Business?
There are several benefits to Google Analytics. Google Analytics tools provide your business with data that will help you understand the strengths and weaknesses of your company’s website. The benefits of Google Analytics include the following:
- Real-time data about who is visiting your site and where they are located
- Information about where your website is the most popular
- What type of browser and device visitors are using to visit your website
- How frequently visitors return to your site
- The amount of time visitors spend on your site
Another benefit of Google Analytics is access to SEO tools — content marketing tools, audience and acquisition reports, behavior reports and flow, and site speed.
Explore Google Analytics
After your Google Analytics account is set up and the tracking code has been added to your website, it will immediately begin collecting data from your website. This data can be accessed from your dashboard. If you need deeper insights into user behavior and performance metrics, marketing analytics services can help interpret the data and optimize your strategy. While the abundant settings options, reports, and tools may seem overwhelming, Google provides instructions and video guides to help you get started. Try Google Analytics today and get to know your customers.
Must-read articles
Looking for something else?
There's so much more
Ready to Inquire?


